High-Frequency Ultrasound
The use of ultrasound is a unique method for visualizing almost all the organs and vascular structures of an experimental subject without causing any harm. This sonography method has been used for clinical purposes for several decades.
The instrument functions according to a fairly simple principle: a specific wave of sound energy is sent into the subject’s body via a probe. When sound propagates through the body, this energy passes layers of tissue and the borders of organs. Each has a density distinct from that of neighboring tissue, impeding the wave of propagating sound differently. This partially scatters the energy from the transmission, and the pattern can be recorded by an external receiver. The signals that echo back to the receiver can be translated into an anatomical image.
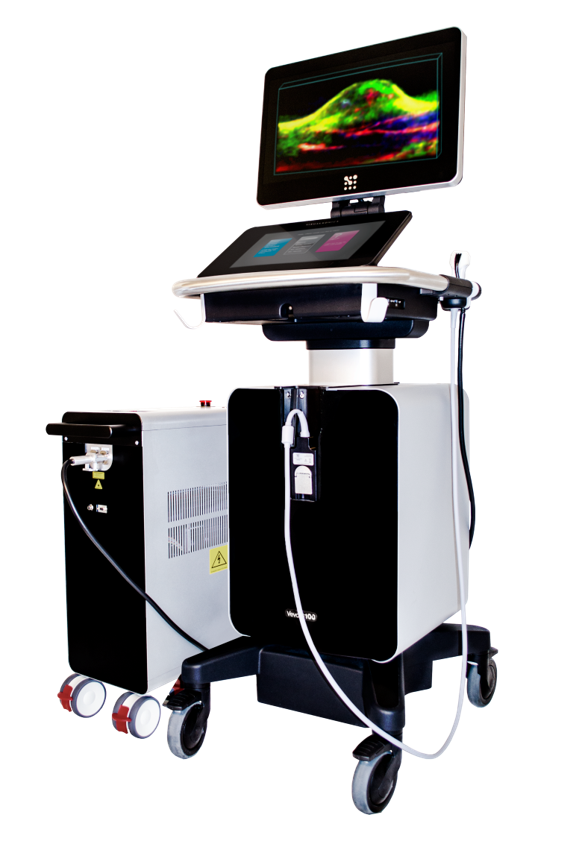
Vevo® 3100 system (VisualSonics)
Technical progress over the last years has led to the development of new sound probes (transducers) that generate frequencies in the range of several MHz. This yields a major increase in spatial and temporal resolution that permits scientists to carry out studies of tissues at a greater level of detail than ever before.
Our services include sonographic studies of small animals using one of the world’s most modern instruments, the Vevo®3100 system (VisualSonics). Its transducers produce frequencies as high as 70MHz, which has permitted the identification of structures as small as 30µm with a maximum temporal resolution of 740 fps.
This makes the platform ideal for pre-clinical research because it allows to examine many organs, tissues, and the behavior of biological systems that need to be studied at this tiny scale.
The non-invasive nature of ultrasound means that it can be used with no harm to animal or human subjects. The only perturbation is the administration of a mild anesthetic that calms the animal so that it won't move and distort the image.
- Acquisition Modes
High Frequency Ultrasound Imaging
Biological processes and phenomena such as blood flow, the thickness of vascular walls, and cardiac function can be observed using a variety of image and processing options. A broad set of ultrasound transducers (MicroScan™-series, VisualSonics) are available to study structures deep in the body – such as subcutaneous tumors, the heart, kidneys, or other organs. The transducers use VisualSonics' "world‘s first ultra-high frequency linear array technology“, providing higher spatial and temporal resolution and covering a range of sound frequencies between 9 and 70MHz. Whether you're exploring the heart or the abdomen in larger animals or the microvasculature of a mouse tumor, we probably already have the transducer you need.
These ultrasound techniques, combined with computer image reconstruction techniques, produce images that are reconstructed into clear, three-dimensional representations of objects and tissues over time. One application is to study the volumes and level of vascularity in a defined anatomical structure that has been chosen in advance.
We have established a wide variety of protocols to analyze the phenotypes of mice and rats: For cardiovascular studies, ultrasound imaging can be used to detect the presence of localized or generalized hypertrophy or a thinning of the myocardium of the left ventricle (LV) and the presence of regional or global wall motion abnormalities associated with systolic dysfunction.
The application of transmitral Doppler analysis permits the detection of abnormal filling patterns associated with LV diastolic dysfunction.
Strain analysis provides a highly sensitive speckle-tracking-based echocardiographic imaging technique that offers a quantitation of the velocity of the walls, displacement, strain, strain rate, and time to peak analysis.
Because of its non-invasive nature, ultrasound can be used in longitudinal studies for tumor diagnosis and monitoring during therapies.
3D-Ultrasound imaging allows for a reliable delineation of tumor boundaries and an assessment of tumor heterogeneity. In addition, ultrasound imaging is ideal for studying pregnancy and embryo development in mice and rats.
Herzschlag eines gesunden Menschen (animiert)
B-Mode
The standard acquisition mode for 2D-analysis of anatomic structures along the plane of sound propagation with brightness-coded visualization
EKV-B-Mode
High-resolution images of B-Mode acquisitions that are ECG-triggered and capable of discovering the smallest aberrations in cardiac movement

3D-B-Mode
Mechanically assisted acquisition of serial B-Mode images that are fused into a three-dimensional image

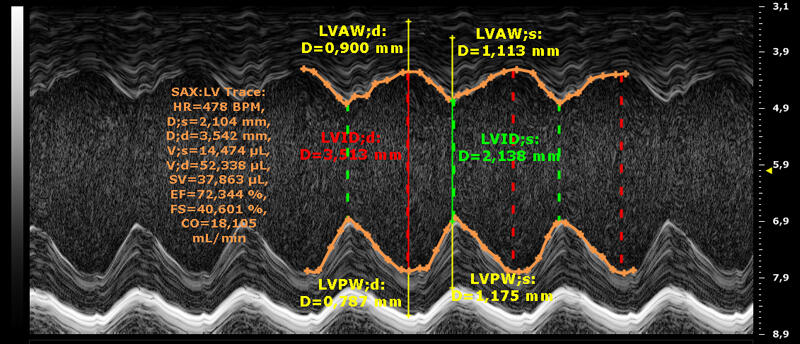
M-Mode
Display of the Movement along a hypothetical axis of sound propagation, e.g. for assessment of wall thickness in systole and diastole

Pulsed Wave Doppler
Measurement of blood flow velocity based on the principle of Doppler-shifts

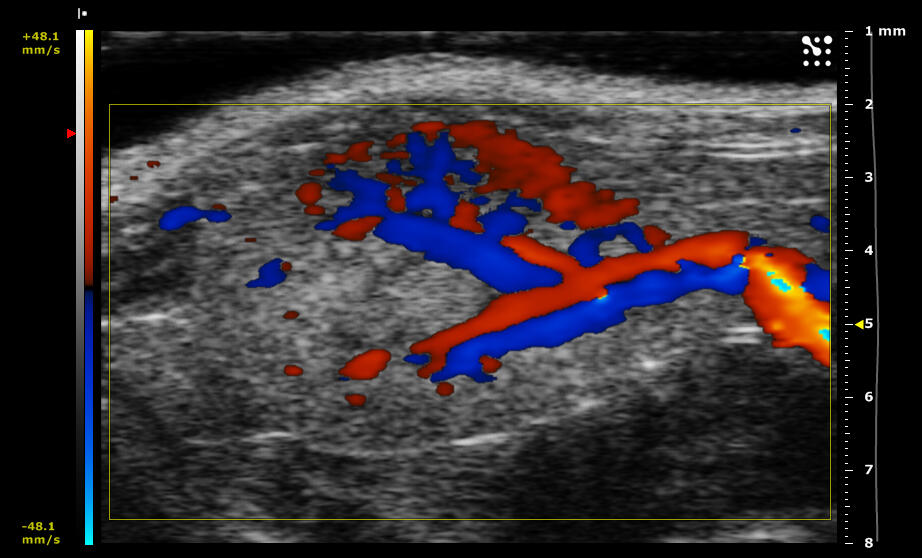
Color-Doppler
Parametric coding of relative velocities towards or away from the propagating sound

Power-Doppler
Parametric coding of relative velocities without directional behavior, e.g. for visualization of vascularity. Compatible with 3D-Mode!

Tissue-Doppler
Measurement of movement within the tissue as a factor of contractility and elasticity

Contrast Mode
Image processing approach with signal enhancement by an echogenic contrast agent in order to visualize small vessels and quantify perfusion
- Ultrasound Parameters
Parameters in High-Frequency Ultrasound
Cardiac Function Abbr. Parameter Unit HR Heart Rate bpm EF trace/simp Ejection Fraction (traced or simpson calculated) % FS Fractional Shortening % SV Stroke Volume µl CO Cardiac Output ml/min Ventricular Morphology Abbr. Parameter Unit IVS-s/d Interventricular Septum Width at Systole/Diastole mm LVPW-s/d Left Ventricular Posterior Wall Width at Systole/Diastole mm LVID-s/d Left Ventricular Inner Diameter at Systole/Diastole mm LV Mass Left Ventricular Mass (calculated) mg RVarea-d Right Ventricular short axis Area at Diastole mm² RVFW-d Right Ventricular Free Wall Width at Diastole mm Mitral Valve Doppler Parameters Abbr. Parameter Unit E Early Rapid Filling Peak Velocity mm/s A Atrial Contraction Filling Peak Velocity mm/s E/A Relation Coefficient of E- and A-Wave Peak Velocity IVRT Isovolumic Relaxation Time ms IVCT Isovolumic Contraction Time ms MV Decel Deceleration Time of Early Filling ms MV ET Ejection Time ms Tei Myocardial Performance Index (Tei index) Description of Mitral Valve Doppler Parameters

The velocity of blood, that gets through the mitral valve into the left ventricle and is further transported through the aortic valve during the heart cycle, can be measured by the pulsed-wave doppler method in high-frequency ultrasound. Characterstic flow patterns, that are typically used in diagnosis of cardiac function, result if these blood flows are measured near the mitral valve. You can see a simplified scheme of a typical mitral-valve flow pattern on the left.
Positive velocities mean inflow of blood via the mitral valve during diastole. Negative velocities correspond with the systolic exhaust of blood through the aortic valve (LV output). Characteristic values of diastolic function (filling velocities 'E' and 'A', IVRT, IVCT...) can be derived from such an velocity profile for diagnostic use.
- Contrast Enhanced Ultrasound
Contrast Agents in High Frequency Ultrasound
Contrast agents (Vevo MicroMarker®, Bracco Corp.) can be used to increase image quality through an impressive enhancement of signal-to-noise ratio and thus lead to a much clearer visualization of blood flow. If the contrast agents are labeled with specific antibodies, they become detectors of endovascular biomarkers such as VEGFR2. A subset of transducers permit "harmonic imaging," based on the non-linear behavior of contrast agents, taking advantage of the much improved signal-to-noise ratio (SNR) and spatial resolution.
The contrast agents we use are tiny, gas-filled bubbles coated with a lipid- or polymer- based shell. Ultrasound makes the bubbles oscillate, creating a much stronger signal that can easily be distinguished from noise. The bubbles are a few microns in diameter (~ 1-2µm), so they remain within the circulation and brighten up vascular structures. This has great potential in clinical applications such as diagnosing the malignancy of a tumor by studying its microvasculature.
Structures of the microvasculature of murine testicle visualized by ultrasonic 3D-Power-Doppler acquisition. The administration of contrast agents results in a strong enrichment of the Doppler signal and a more detailed display of the vasculature.
Microbubbles have a unique signal behavior that stands out against a noisy biological background and permits scientists to achieve images of higher resolution. Microbubbles emit a "non-linear" signal that can easily be spotted against the linear energy of the background tissue. This unique, microbubble-restricted signal is processed again to produce harmonic imaging that further increases the contrast between a structure and its surroundings.
Administration of a contrast agent resulting in signal enhancement with a distinct delineation of myocardial borders by using non-linear signal and harmonic imaging (bottom right)
Targeted Contrast Agents as Biodetectors
Preparation of custom targeted contrast agents
Special forms of antibodies can also be used as detectors to observe changes in the levels of specific proteins on the surface of blood vessels. Such changes commonly occur during inflammations, the development of a disease, or as a response to other types of environmental change. So, ultrasonic contrast agents open many new avenues to study biomarkers in living animals, in a non-invasive way. The use of ultrasonic contrast agents is a sophisticated and innovative method of the non-invasive in vivo detection of biomarkers, bringing on several advantages in experimental procedure, animal behavior and approval.
Left: Schematic illustration of the acquisition strategy using targeted contrast agents in ultrasonic imaging. Right: Ultrasonic signals of a targeted contrast agent (green) and an isotype control (red) in contrast to the baseline signal (blue). The signal of the targeted contrast agent, that has bound to its target specifically, diminishes after a destruction sequence of high ultrasonic power is initiated (yellow frame). After destruction, the signal intensity of the targeted contrast agent reaches that of the isotype control which corresponds to the signal of free, unbound contrast agent in the bloodstream.
- Strain Analysis
Functional Assessments of Cardiac Strain
As ultrasound echoes pass through a body, they produce a unique pattern of "speckles" in each tissue. Measurements of these patterns help delineate the borders of adjacent organs. Subtle variations in the spacing of the speckles expose sub-regions of an organ and changes in its activity. These variations in the patterns, which change over time and when responding to conditions such as disease, allow researchers to investigate how each region of the organ functions normally as well as in special conditions such as disease.
In the case of the heart, diseases such as heart attacks are marked by a loss of cardiac function. A sign of such changes is a reduction in the strain and strain rate, as shown by EEG measurements, MRI analysis, and histological stainings of infarct zones.
We use a post-processing software called Vevo-Strain™ from Visual Sonics to analyze myocardial events. To make a diagnosis, scientists provide a myocardial analysis of regional functions using the Vevo-Strain™ system. Crucial parameters such as segmental velocity, displacement, strain, strain-rate and the overall ejection fraction can be exported along with corresponding time-to-peak values. Additionally, parametric displays can be delivered, including impressive 3D-displays of strain development during the heart cycle.
Scheme of myocardial strain analysis in a model of infarcted murine heart. Dynamic traces represent regions of the anterior base (blue) and midwall (red), apex (green), posterior base (pink) and midwall (turquoise). Note that the anterior midwall (red line, bottom panel) shows complete akinetic behavior after myocardial infarct (arrows). Corresponding anatomical M-Mode-displays show distinct parametric patterns of akinetic behavior of the infarct zone and irregular movements of neighboring areas. Synchronicity-Page-Mapping (Sync.) reveals a dyssynchronicity of 40 ms in velocity and displacement (50 ms in strain and strain rate, respectively) of the affected areas (arrowheads). The loss of myocardial function due to the infarct is impressively shown in the 3D-M-Mode-display (asterisk).
Super-resolving EKV-Mode acquisitions can also be used for strain analysis, providing outstanding accuracy in the assessment of contractility by speckle tracking.
This technique might be the current "gold-standard" in the prediction and follow-up of myocardial dysfunction and supplies researchers with publication-ready datasets.
See below an example of how Strain Analysis can be done on models of myocardial infarcts:
Strain Analysis of Mycoardial Infarct
This VIDEO demonstrates the way through a strain analysis of a murine heart prior and post myocardial infarct. In a B-Mode cine-loop, the myocardial borders are traced (green) and regional motility is indicated by vectors (green arrows). Subsequently, crucial parameters of velocity, displacement, strain and strain-rate are recorded as well as time-to-peak analysis and synchronicity maps.
- EKV Imaging
EKV-Mode Imaging
The Electrocardiographic-gated Kilohertz -Visualization system permits outstanding spatial and temporal resolution of cardiac movement. This substantial advancement in B-Mode imaging is based on collecting multiple single heart-cycles that are automatically matched to the subject’s corresponding ECG-signal. The acquisitions are subsequently combined into a single heart cycle that is displayed with the accuracy of several hundred frames captured.
Conventional B-Mode acquisition of the left ventricle (three consecutive heart-beats with respiratory movement)
EKV-enhanced acquisition of the same heart with improved spatial and temporal resolution
This increase in resolution is essential in identifying the smallest aberrations of myocardial movement. Using other acquisition techniques, these aberrations might go undiscovered because of the high frequency of heartbeats in small animals.
EKV enhanced tracing of the murine left Ventricle in Long-Axis-View
EKV enhanced tracing of the murine left Ventricle in Short-Axis-View
Boosting both temporal and spatial resolution improves the accuracy of further measurements of any EKV-acquired B-Mode image. An investigator can obtain a better visual definition of structural borders. This makes the temporal tracing and marking of structures such as the cardiac left ventricular boundary much more precise and improves the validity of calculations based on parameters such as the ejection fraction, fractional shortening, cardiac output etc.
EKV-triggered B-Mode imaging is an excellent way to increase the level of detail in ultrasonic images, improving motion detection, tracing and calculating. It provides images that are more suitable for use in presentations, publications etc..
- 3D-Imaging
With motor-driven transducers, it is possible to gather serial acquisitions of an organ. These B-Mode images are post-processed into a three-dimensional model, e.g. for volumetric assessment of an organ or for visualization of the vasculature.
See some examples below of how this technique can be used for the volumetric assessment of a subcutaneous tumor:
3D-Modelling for volumetric Assesments
With three-dimensional data of ultrasonic B-Mode acquisitions, it is easy to orientate within a region and go through the structure of interest. This VIDEO shows a subcutaneous tumor that can be viewed from all sides. The tumor can be delineated from normal tissue (red marks). Doing this stack by stack, the whole tumor is gauged in order to asses its volume.
3D-Modelling of serial Power-Doppler Acquisitions
This VIDEO demonstrates the power of offline-modelling of 3D-Power-Doppler data. With the Power-Doppler engaged, blood flow in vessels is highlighted in red whereas other tissue is coded in B-Mode grey-scale. Several tools for sculpturing are available to get the most representative view of the region of interest.